 Meziantou.Framework
XY charts
editAn XyChart draws series of values as bars and lines, over an x axis of categories or of numbers and a y axis of numbers (Mermaid xychart):
var diagram = new XyChart { Title = "Sales revenue" };
foreach (var month in new[] { "Jan", "Feb", "Mar", "Apr", "May", "Jun" })
{
    diagram.XAxis.Categories.Add(month);
}

diagram.YAxis.Title = "Revenue (k$)";
diagram.YAxis.Range = new XyChartAxisRange(0, 120);
diagram.AddBars([50, 62, 75, 82, 95, 105], "Actual");
diagram.AddLine([55, 60, 70, 85, 90, 110], "Target");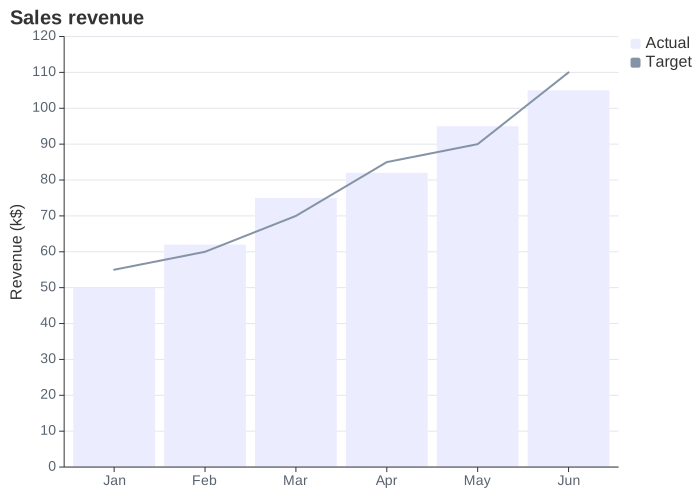
The chart is drawn with Meziantou.Framework.Charts: a bar mark or a line mark per series, in the colors of the XY charts of the Mermaid theme. It looks like the other charts of Charts, not like the output of Mermaid.
Axes
XAxis and YAxis are XyChartAxis objects:
- The x axis shows its Categories when it has some: the value at an index of a series belongs to the category at the same index, and the values past the last category are not drawn. A category written twice is shown once. Without categories, the x axis shows the numbers of its Range, and spreads the values of each series from its start to its end. Without range either, it numbers the values of the first series from 1. With bars, the axis goes half the distance between two bars past its ends, so the first and the last bars stay in the plot.
- The y axis shows the numbers of its Range. Without range, it fits the values of the series with round ends, from zero when the chart has bars. A value out of the range is cut at the edge of the plot.
An XyChartAxisRange goes from its start to its end, which can be lower to reverse the axis. Each axis has a Title, and options to hide its title, its labels, its ticks and its line, and to set the length of its ticks. LabelRotation rotates the labels below a vertical chart. Orientation puts the x axis on the left: the bars are horizontal, and the categories read from the top down.
Series
AddBars and AddLine add an XyChartBarSeries or an XyChartLineSeries. The series are drawn in order, so the bars of two series at the same place overlap, and take the colors of PlotColors, or of the theme, in turn. The bars start at zero, or at the end of the range of the y axis closest to zero.
- A series with a Name is listed in the legend, on the right of the plot. A name is listed once: the next series of the same name keep their own colors. ShowLegend hides the legend.
- ShowDataLabels writes the value of each bar inside it, against its end, or past its end with DataLabelsOutsideBars.
- PointLabels writes a text next to the points of a line, in its color.
Size, fonts and colors
The chart is Width by Height pixels, 700 by 500 by default. Charts lays out the title, the axes and the legend, and gives the plot the rest. It has one font size and one color for each kind of element, so some options of Mermaid share them:
| Charts uses | From |
|---|---|
| The size of the title | TitleFontSize |
| The size of the labels of the ticks | The largest LabelFontSize of the two axes |
| The size of the titles of the axes and of the legend | The largest of the TitleFontSize of the axes and LegendFontSize |
| The background | BackgroundColor |
| The color of the title, the titles of the axes and the legend | The first set of TitleColor, LegendTextColor and the TitleColor of the x axis, then of the y axis |
| The color of the labels of the ticks | The LabelColor of the x axis, else of the y axis |
| The color of the lines and the ticks of the axes | The first set of the LineColor of the x axis, of the y axis, then of their TickColor |
| The color of the values of the bars | DataLabelColor |
The other options are written back by MermaidWriter but not drawn: PlotReservedSpacePercent, TitlePadding and LegendPadding of the chart, and LabelPadding, TitlePadding, TickWidth and LineWidth of the axes. ShowLabels hides the labels of numbers only: the categories are always shown.
Customize the plot
ToPlot returns the Plot that draws the chart, to change what Mermaid cannot say before drawing it:
var chart = (XyChart)MermaidDocument.Parse("""
    xychart
        title "Sales Revenue"
        x-axis [jan, feb, mar, apr, may, jun]
        bar [5000, 6000, 7500, 8200, 9500, 10500]
    """).Content;

var plot = chart.ToPlot();
plot.Subtitle = "First half of the year";
plot.YAxis.Grid = false;
var svg = plot.ToSvg();
Mermaid syntax
var diagram = (XyChart)MermaidDocument.Parse("""
    xychart
        title "Sales Revenue"
        x-axis [jan, feb, mar, apr, may, jun]
        y-axis "Revenue (in $)" 4000 --> 11000
        bar [5000, 6000, 7500, 8200, 9500, 10500]
        line [5000, 6000, 7500, 8200, 9500, 10500]
    """).Content;
xychart and xychart-beta are read the same, followed by horizontal or vertical. The statements are title, x-axis title [categories], x-axis title start --> end, y-axis title start --> end, bar name [values] and line name [values], where a value of a line can have a quoted label: line [540 "PaLM", 65]. The parser follows the grammar of Mermaid, quirks included: a text without quotes is made of pieces joined without their spaces (title Sales Revenue is SalesRevenue), and after x-axis and y-axis the digits are numbers, so a title such as Q1 must be quoted. The entity codes, such as #35;, are read in quoted texts only. The labels of the values of a bar are read but not drawn, as in Mermaid, with a warning.
The xyChart section of the configuration sets the options of the chart: width, height, titleFontSize, titlePadding, showTitle, showLegend, legendFontSize, legendPadding, plotReservedSpacePercent, showDataLabel, showDataLabelOutsideBar, chartOrientation, and the options of xAxis and yAxis. The xyChart section of the theme variables sets the colors: backgroundColor, titleColor, dataLabelColor, legendTextColor, the title, label, tick and line colors of each axis, and plotColorPalette. The writer writes the options in the front matter and the colors in an init directive.
Differences with Mermaid:
- The axes apply wherever they are written: in Mermaid, a series written before
x-axisis placed on the axis that existed when it was read. - Without range, the y axis starts at zero when the chart has bars: in Mermaid, it starts at the lowest value, whose bar has no height.
- The values written on the bars are those of each bar, in the font of the labels of the ticks: Mermaid writes the values of the first series on every bar series, in the largest font that fits every bar.
- The markers of the legend are squares, for the lines too.
- A chart without series is drawn empty: Mermaid reports an error.