 Meziantou.Framework
Sankey charts
editA SankeyChart draws flows between nodes: each link goes from a source node to a target node, as wide as its value, and the nodes are as high as the flows that go through them (Mermaid sankey). The chart is drawn by the SankeyMark<T> of Meziantou.Framework.Charts:
var diagram = new SankeyChart { Title = "Energy flows (TWh)", Height = 300 };
diagram.AddLink("Solar", "Electricity", 60);
diagram.AddLink("Wind", "Electricity", 90);
diagram.AddLink("Gas", "Electricity", 120);
diagram.AddLink("Gas", "Heating", 80);
diagram.AddLink("Electricity", "Homes", 110);
diagram.AddLink("Electricity", "Industry", 140);
diagram.AddLink("Electricity", "Losses", 20);
diagram.AddLink("Heating", "Homes", 80);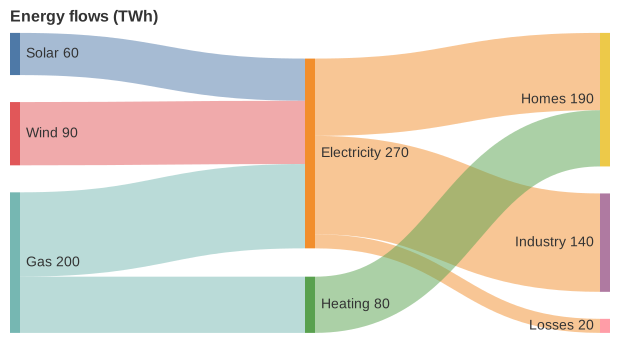
Nodes and links
AddLink adds a link between two nodes, named by the link: the nodes are the sources and the targets of the links, in the order they appear (GetNodes). The values are positive numbers, or zero. Two links between the same nodes are drawn as two links.
The links must not form a cycle: the parser rejects one, and a link that closes a cycle in a chart built in code is not drawn, nor a node that only such links name, such as a node linked to itself.
Layout
The layout is the one of d3-sankey, which Mermaid uses. The nodes are placed in columns by the number of links before them, then moved toward the nodes they are linked to. NodeAlignment chooses the column of the nodes: Justify (the default) puts the nodes without outgoing links in the last column, Left keeps every node in the column of its depth, Right aligns the nodes on the last column, and Center puts the nodes without incoming links just before their first target.
Width and Height are the size of the area of the nodes and the links, 600 by 400 pixels by default: the image adds a margin of 10 pixels around it, and the title above it. NodeWidth is the width of a node, and NodePadding the space between the nodes of a column, to which Mermaid adds 15 pixels when the labels show the values.
Colors and labels
The nodes take the colors of the Tableau 10 scheme, in their order, as in Mermaid, whatever the theme, unless NodeColors gives them one. The links are half transparent. LinkColoring colors them with the color of their Source or of their Target, and LinkColor gives every link the same color instead. The default, Gradient, a gradient from the color of the source to the color of the target in Mermaid, is drawn as Source.
The label of a node is its name and its value, the larger of the totals of its incoming and outgoing links, rounded to two decimals and written as JavaScript writes numbers, between ValuePrefix and ValueSuffix. ShowValues hides the values. The labels are after the nodes of the left half and before the nodes of the right half, on one line. The tooltip of a link gives its source, its target and its value.
LabelStyle is written back, but Outlined is drawn as Legacy: the labels are not outlined, nor placed by column.
Customize the drawing
ToPlot returns the Plot that draws the chart, with one SankeyMark<T> and the colors of the nodes in the palette of its theme. Change it to go beyond what Mermaid can say, as the overview shows.
Mermaid syntax
var diagram = (SankeyChart)MermaidDocument.Parse("""
    sankey

    Solar,Electricity,60
    Wind,Electricity,90
    Gas,Electricity,120
    Gas,Heating,80
    Electricity,"Homes, offices",110
    Electricity,Industry,140
    Heating,"Homes, offices",80
    """).Content;
sankey and sankey-beta are read the same. Each line is a link, source,target,value, as a row of a CSV file: a name with a comma, a quote or a line break is between double quotes, and a quote in it is written twice ("a ""b"", c"). The names are trimmed, and the blank lines are ignored. A value is the number that starts its field, as JavaScript reads it (1e3 is 1000). The parser reads width, height, nodeWidth, nodePadding, linkColor (gradient, source, target or a color), nodeAlignment, showValues, prefix, suffix, labelStyle (legacy or outlined) and nodeColors (a mapping of the names of the nodes to colors) in the sankey section of the configuration, and the title of the front matter.
Mermaid rejects the names with characters that are not ASCII, and draws nothing for the values that are not positive numbers and for the links that form a cycle. Here, the names can have any character, and a value that is not a positive number or a cycle is an error. The grammar has no accessibility statements, so the writer rejects a chart with an AccessibleTitle or a Description.