 Meziantou.Framework
Radar charts
editA RadarChart draws axes around a center, and curves that join a value on each axis, to compare several series over several dimensions (Mermaid radar-beta). It is also known as a spider, star or polar chart, or a Kiviat diagram:
var diagram = new RadarChart { Title = "Grades", Maximum = 100 };
diagram.AddAxis("m", "Math");
diagram.AddAxis("s", "Science");
diagram.AddAxis("e", "English");
diagram.AddAxis("h", "History");
diagram.AddAxis("g", "Geography");
diagram.AddAxis("a", "Art");
diagram.AddCurve("a", "Alice", 85, 90, 80, 70, 75, 90);
diagram.AddCurve("b", "Bob", 70, 75, 85, 80, 90, 85);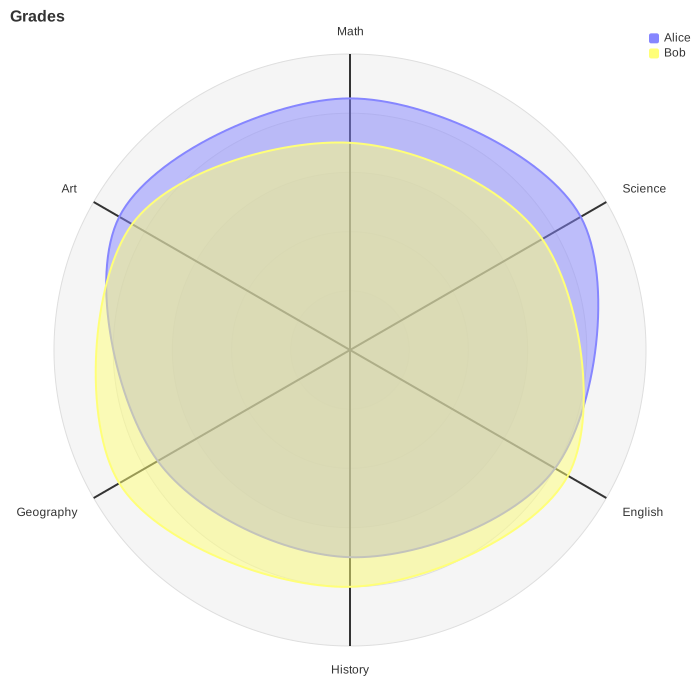
The chart is drawn with Meziantou.Framework.Charts, in polar coordinates, in the colors of the Theme: it looks like the other charts of that library, not like the output of Mermaid.
Axes and curves
A RadarAxis has a Name and a Label, drawn at its end. The axes are clockwise from the top. A RadarCurve has a name, a label for the legend, and Values in the order of the axes. The curves are closed and filled. They take the colors of the palette of the theme, in their order, and the legend lists them in the top right corner.
As Mermaid:
- A curve that does not have a value for each axis is not drawn, but the legend lists it.
- The values out of the scale are drawn at the center or at the end of the axes.
- No curve is drawn when the maximum is not greater than the minimum.
Scale
| Property | Description | Default |
|---|---|---|
| Maximum | The value at the end of the axes | The largest value of the curves |
| Minimum | The value at the center | 0 |
| Ticks | The number of circles or polygons of the scale, up to 32 | 5 |
| Graticule | Circles with rounded curves, or polygons with straight curves | Circle |
| ShowLegend | Whether the legend lists the curves | true |
Layout and style
The chart is Width by Height (600), within margins of 50 (MarginTop...). The labels of the axes are drawn in the margins, and the title and the legend in the top margin: give long labels wider margins. AxisScaleFactor sets the length of the axis lines, and AxisLabelFactor the distance of their labels, as ratios of the radius.
The colors, widths, opacities and font sizes are the radar theme variables of Mermaid: AxisColor, AxisStrokeWidth, AxisLabelFontSize, CurveOpacity, CurveStrokeWidth, GraticuleColor, GraticuleOpacity, GraticuleStrokeWidth and LegendFontSize.
CurveTension is written back to Mermaid, but it is only partly drawn: the rounded curves are Catmull-Rom splines, which have no tension, and a tension of 0 draws straight lines.
Customize the drawing
ToPlot returns the Plot that draws the chart, to add marks before drawing it. Around the circle, the x scale goes from 0 to 1, with the axes at equal steps from 0. The y scale is the scale of the values, from the minimum at the center to the maximum at the end of the axes:
var chart = new RadarChart { Title = "Player skills", Maximum = 100, Width = 300, Height = 300 };
chart.AddAxis("speed", "Speed");
chart.AddAxis("power", "Power");
chart.AddAxis("agility", "Agility");
chart.AddAxis("focus", "Focus");
chart.AddCurve("ada", "Ada", 80, 55, 90, 70);
chart.AddCurve("bob", "Bob", 60, 85, 50, 75);

// The radius is the scale of the values: a rule at 50 is a circle halfway to the end of the axes
var plot = chart.ToPlot();
plot.Add(new RuleYMark(50) { StrokeColor = SceneColor.Parse("#e5484d"), StrokeWidth = 2, StrokeDashArray = [6, 4] });
var svg = plot.ToSvg();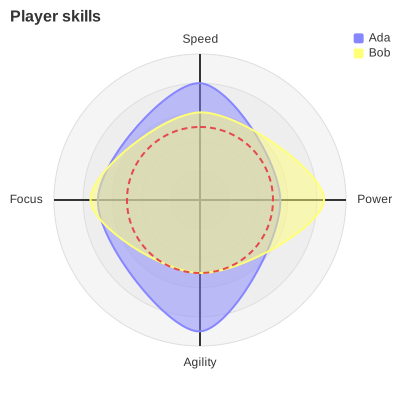
When the chart draws no curve, because the maximum is not greater than the minimum, or when the values at the end of the axis lines or at their labels do not fit a double, the y scale goes from 0 to 1 instead, as fractions of the radius.
Mermaid syntax
var diagram = (RadarChart)MermaidDocument.Parse("""
    radar-beta
      title Restaurant Comparison
      axis food["Food Quality"], service["Service"], price["Price"]
      axis ambiance["Ambiance"]
      curve a["Restaurant A"]{4, 3, 2, 4}
      curve b["Restaurant B"]{ price: 3, service: 4, ambiance: 3, food: 3 }
      graticule polygon
      max 5
    """).Content;
axis declares axes, id or id["label"], separated by commas. curve declares curves, id["label"]{values}, where the values are numbers in the order of the axes, or axis: value pairs in any order. The options are showLegend (true or false), ticks, max, min and graticule (circle or polygon); the last value of an option wins. As the grammar of Mermaid, the statements do not need their own lines, and the values of a curve can span lines.
An identifier is made of ASCII letters, digits, underscores and dashes, and starts with a letter or an underscore. As Mermaid, an identifier cannot be a keyword, nor start with true, false, circle, polygon or title, which Mermaid reads as other tokens.
The parser reads width, height, the margins, axisScaleFactor, axisLabelFactor and curveTension in the radar section of the configuration, and the radar theme variables. The differences with Mermaid:
- A number of ticks that is not an integer is rounded up, and reported as a warning.
- The colors of the curves repeat after the 12 colors of the palette, where Mermaid leaves the next curves black.
- The names
accTitleandaccDescrare not identifiers.