 Meziantou.Framework
Quadrant charts
editA QuadrantChart draws points on two axes that go from 0 to 1, over a square split into four quadrants (Mermaid quadrantChart):
var diagram = new QuadrantChart
{
    Title = "Reach and engagement of campaigns",
    XAxisLeftLabel = "Low Reach",
    XAxisRightLabel = "High Reach",
    YAxisBottomLabel = "Low Engagement",
    YAxisTopLabel = "High Engagement",
    Quadrant1Label = "We should expand",
    Quadrant2Label = "Need to promote",
    Quadrant3Label = "Re-evaluate",
    Quadrant4Label = "May be improved",
};
diagram.AddPoint("Campaign A", 0.3, 0.6);
diagram.AddPoint("Campaign B", 0.45, 0.23);
diagram.AddPoint("Campaign C", 0.57, 0.69).Style.Color = SceneColor.Parse("#ff3300");
diagram.AddPoint("Campaign D", 0.78, 0.34).ClassName = "important";
diagram.ClassDefinitions["important"] = new QuadrantChartPointStyle { Radius = 10, Color = SceneColor.Parse("#109060") };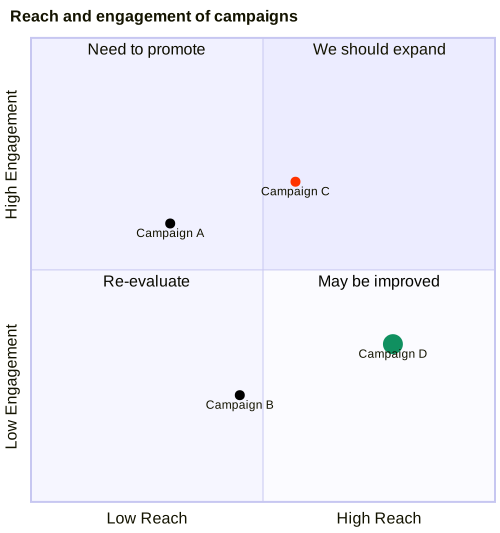
Quadrants and axes
The quadrants are numbered as in mathematics: Quadrant1Label is the text of the top right quadrant, then the top left, the bottom left and the bottom right ones. Without points, the texts of the quadrants are in their middle; with points, at their top, so they do not hide the points.
Each axis has two texts: XAxisLeftLabel and XAxisRightLabel, drawn in the middle of their half of the axis, or only the first one, drawn at its start. The texts of the y axis are turned to read from the bottom. XAxisPosition puts the texts of the x axis at the top, the default, or at the bottom; as in Mermaid, they are always at the bottom when the chart has points. YAxisPosition puts the texts of the y axis on the left or on the right. The axes have no ticks: the texts name the ends of the axes.
Width and Height are the size of the chart with the texts of the axes, 500 pixels by default; the Title is drawn above it, and makes the image taller. The paddings, the font sizes and the widths of the borders of Mermaid are properties too, such as QuadrantLabelFontSize, ExternalBorderWidth and PointRadius. A line feed in a text starts a new line.
Points and styles
A point has a text drawn below it, and a Style: its radius, its fill color, and the color and the width of its border. A point can also take the style of a class: its ClassName is a key of ClassDefinitions. The values of the point take precedence over the ones of its class, which take precedence over the default. The first points are drawn above the next ones, as in Mermaid. A large point is not clipped to the quadrants: it can cover the texts near it.
The quadrants are filled with the primary color of the theme, a little lighter from the first quadrant to the fourth one, and the points are black, as Mermaid draws them (the text color on a dark theme). Colors replaces any of these colors, as the quadrant* theme variables of Mermaid do.
A markdown text keeps its markdown when it is written back, but its bold and italic parts are drawn as plain text.
Customize the drawing
The chart is drawn with Meziantou.Framework.Charts: ToPlot returns a Plot whose x and y scales go from 0 to 1, with hidden axes, and whose marks draw the quadrants, the borders, the points and the texts. Add marks to it, then draw it:
var diagram = new QuadrantChart { Title = "Risks", XAxisLeftLabel = "Unlikely", XAxisRightLabel = "Likely" };
diagram.AddPoint("Outage", 0.8, 0.9);
diagram.AddPoint("Data loss", 0.2, 0.95);

// The axes go from 0 to 1: a dashed line marks the likelihood above which a risk needs a plan
var plot = diagram.ToPlot();
plot.Add(new RuleXMark(0.7) { StrokeColor = SceneColor.Parse("#cc0000"), StrokeDashArray = [4, 4] });
var svg = plot.ToSvg();
The plot has a fixed Margin, which leaves room for the title and the texts of the axes only: change it too when you add a subtitle or a legend.
Mermaid syntax
var diagram = (QuadrantChart)MermaidDocument.Parse("""
    quadrantChart
        title Reach and engagement of campaigns
        x-axis Low Reach --> High Reach
        y-axis Low Engagement --> High Engagement
        quadrant-1 We should expand
        quadrant-2 Need to promote
        quadrant-3 Re-evaluate
        quadrant-4 May be improved
        Campaign A: [0.3, 0.6]
        Campaign B:::important: [0.45, 0.23] radius: 12, color: #ff3300
        classDef important stroke-color: #310085, stroke-width: 2px
    """).Content;
The parser follows the grammar of Mermaid, and accepts and rejects the same texts. A statement ends at a line feed or a semicolon, and the keywords ignore the case. x-axis left --> right sets the texts of the x axis, x-axis left --> adds an arrow to the left one; y-axis bottom --> top the texts of the y axis. A point is text:::class: [x, y] styles, where the class is optional, a coordinate is 0, 1, or 0. followed by digits, and the styles are radius: 10, color: #ff3300, stroke-color: #10f0f0 and stroke-width: 5px, separated by commas. classDef name styles defines a class.
A text is made of words, spaces, dashes and most punctuation, but no colon. A text between double quotes can contain any character but a double quote, and "`text`" is a markdown text. As in Mermaid, title, x-axis and the other keywords start their statement wherever a word starts, and %% starts a comment, so such a text needs quotes. The parser reads the quadrantChart section of the configuration (chartWidth, chartHeight, pointRadius, xAxisPosition...), and the quadrant* theme variables.
The writer quotes the texts that need it. It throws for a text with a double quote, a markdown text with a backquote, a class name with other characters than letters, digits and underscores, or a color that is not opaque.