 Meziantou.Framework
Theming and accessibility
editThemes
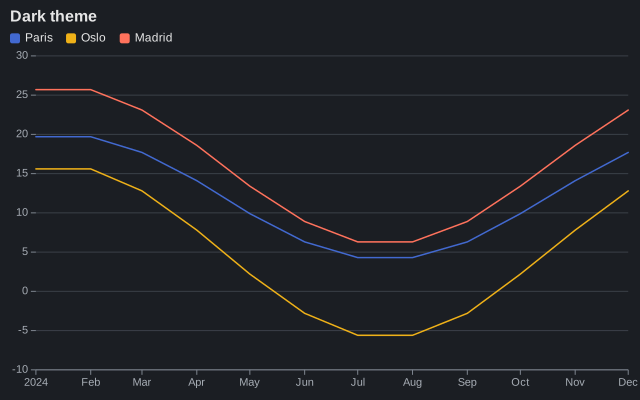
A ChartTheme holds the colors, the fonts and the stroke widths of a chart. ChartTheme.Light is the default, and ChartTheme.Dark draws light text on a dark background:
var plot = new Plot { Title = "Dark theme", Theme = ChartTheme.Dark };
plot.Add(new LineMark<Reading>(SampleData.Readings, x: reading => reading.Date, y: reading => reading.Temperature)
{
    Stroke = reading => reading.City,
});
A theme is a record: change it with a with expression. The palette colors the categories, in order, and a background set to null makes the chart transparent:
var theme = ChartTheme.Light with
{
    FontFamily = "Georgia, serif",
    Palette = ["#264653", "#2a9d8f", "#e9c46a", "#f4a261", "#e76f51"],
    Background = null,
};
var plot = new Plot { Title = "Custom theme", Theme = theme };
plot.Add(new BarMark<Sale>(SampleData.Sales, x: sale => sale.Region, y: sale => sale.Amount)
{
    Fill = sale => sale.Year,
    Transform = new StackTransform(),
});
The continuous color scales take a ColorScheme: viridis, magma, blues, greens, oranges, reds, greys, and the diverging red-blue and red-yellow-green ramps, or your own stops. The colors are interpolated in OKLab, so the steps of a ramp look even.
Accessibility and styling
The SVG has role="img". The title of the plot is its accessible name (a title element), and Plot.Description adds a desc element that describes the chart for screen readers. The Title channel of the marks adds a tooltip to each shape, and CssClass a class to the group of a mark, to style it from the page:
var plot = new Plot
{
    Title = "Sales by region",
    Description = "North sold 150, South 95, East 105 and West 160 thousand euros in 2024.",
};
plot.Add(new BarMark<Sale>(SampleData.Sales.Where(sale => sale.Year == 2024), x: sale => sale.Region, y: sale => sale.Amount)
{
    Title = sale => $"{sale.Region}: {sale.Amount}",
    CssClass = "sales",
});
var svg = plot.ToSvg(new SvgRenderOptions { IdPrefix = "sales", IncludeNamespace = false });
The DataAttributes channel adds data-* attributes to each shape, for the scripts of a web page: see tooltips in a web page.
Texts from users are safe to chart: the markup characters are escaped, and the characters XML forbids are removed.