 Meziantou.Framework
Image rendering
editMeziantou.Framework.Imaging.Charts draws the charts with Meziantou.Framework.Imaging: as images in any format the library writes, or as vector shapes on an existing image.
dotnet package add Meziantou.Framework.Imaging.ChartsThe types are in the Meziantou.Framework.Imaging.Charts namespace. The examples also use the Meziantou.Framework.Charts, Meziantou.Framework.Imaging and Meziantou.Framework.Imaging.Formats namespaces.
Render a chart as an image
ToImage renders a plot as an image of its size. Scale multiplies the pixels, for high-density screens:
Fruit[] fruits = [new("Apples", 12), new("Bananas", 7), new("Cherries", 18)];
var plot = new Plot { Title = "Fruits sold", Width = 400, Height = 250 };
plot.Add(new BarMark<Fruit>(fruits, x: fruit => fruit.Name, y: fruit => fruit.Count));

using var image = plot.ToImage();
Assert.Equal((400, 250), (image.Width, image.Height));

// Save to a file (image.Save("fruits.png")) or to a stream, in any format
using var png = new MemoryStream();
image.Save(png, new PngEncoder());

// Twice the pixels, for high-density screens
using var retina = plot.ToImage(new ChartImageOptions { Scale = 2 });
Assert.Equal((800, 500), (retina.Width, retina.Height));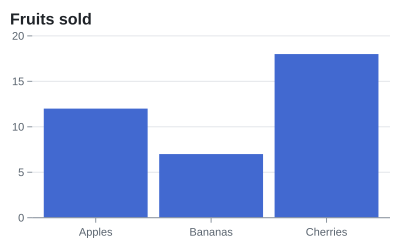
The image renderer and the SVG renderer draw the same layout (ChartScene), so an image looks like the SVG of the same plot.
Draw a chart on a canvas
DrawChart draws a plot on a canvas at a position: the transform, the clip and the layers of the canvas apply. MeasureChart gives its size first:
using var report = new Image<Rgba32>(500, 300, Colors.White); // or Image.Load<Rgba32>("report.png")
var plot = new Plot { Width = 300, Height = 200, Theme = ChartTheme.Light with { Background = null } };
plot.Add(new ArcMark<Fruit>([new("Apples", 12), new("Bananas", 7)], value: fruit => fruit.Count) { Fill = fruit => fruit.Name });

var size = ChartImageRenderer.MeasureChart(plot);
Assert.Equal((300, 200), (size.Width, size.Height));

// Drawn as vector shapes and text: the transform and the clip of the canvas apply
report.Draw(canvas => canvas.DrawChart(plot, new PointD(180, 80)));
Fonts
The plot is laid out with the font that draws it, so the margins, the rotated labels and the truncated labels fit. The package embeds Liberation Sans (ChartFonts), subset to the Latin characters. Its widths are those of Helvetica and Arial, the widths the SVG renderer uses by default; their kerning differs a little, so a text can be slightly narrower or wider in an image than in an SVG.
For other scripts, pass a font that has them in ChartImageOptions.Font, for instance a font installed on the machine, from SystemFontCollection. BoldFont sets the font of the bold texts.