 Meziantou.Framework
Getting started
editInstall the package
Add the Meziantou.Framework.Charts package to a project:
dotnet package add Meziantou.Framework.ChartsThe types are in the Meziantou.Framework.Charts namespace.
Create a chart
The examples of this documentation chart records such as this one:
public sealed record Sale(string Region, int Year, double Amount);Create a Plot, add a mark that draws the rows, and write the SVG:
Sale[] sales =
[
    new("North", 2024, 150),
    new("South", 2024, 95),
    new("East", 2024, 105),
    new("West", 2024, 160),
];

var plot = new Plot { Title = "Sales by region", Subtitle = "2024, in thousands of euros" };
plot.Add(new BarMark<Sale>(sales, x: sale => sale.Region, y: sale => sale.Amount));
var svg = plot.ToSvg();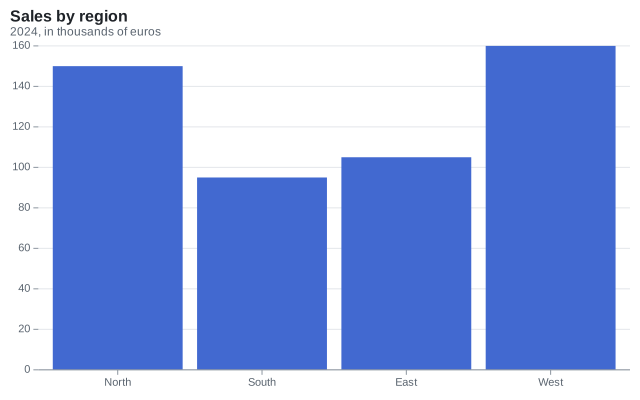
The constructor of a mark takes the rows and its main channels: here, the region on x and the amount on y. A channel is a function of a row. The plot infers the rest: a band scale for the regions, a linear scale from zero for the amounts, the ticks, the margins and the axes.
Use the SVG
ToSvg returns the SVG document as a string. WriteSvg writes it to a TextWriter or to a Stream, in UTF-8. The document can be saved as a .svg file, served with the image/svg+xml content type, or written inline in an HTML page. When a page shows several charts, give each one its own SvgRenderOptions.IdPrefix, so the identifiers of their gradients and clip paths do not collide.
To get an image instead, see Image rendering.