Meziantou.Framework
Small multiples
editFacets split a chart into a grid of small charts, one per value of the FacetX channel (the columns) and of the FacetY channel (the rows) of the marks (Mark<T>.FacetX, Mark<T>.FacetY). The charts share the scales, so they compare at a glance. The rows of each facet are prepared apart: stacks, bins and pie totals apply to each facet. A mark without facet channels, such as a reference line, is drawn in every chart. The axes are drawn on the outer charts, and the facets are the headers of the columns and the labels of the rows.
Facets
A column per value of FacetX.
var plot = new Plot { Title = "Sales by region, one chart per year", Height = 300 };
plot.Add(new BarMark<Sale>(SampleData.Sales, x: sale => sale.Region, y: sale => sale.Amount)
{
    FacetX = sale => sale.Year,
    Fill = sale => sale.Region,
});
plot.Legend.Visible = false;
plot.YAxis.Label = "Amount";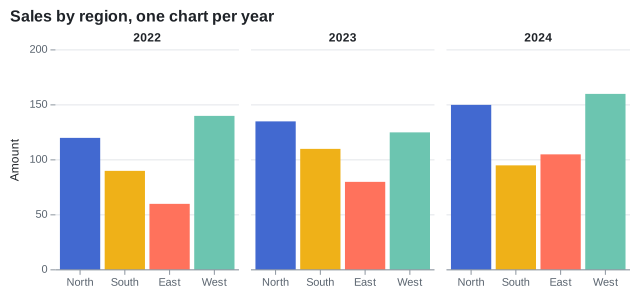
Wrapped facets
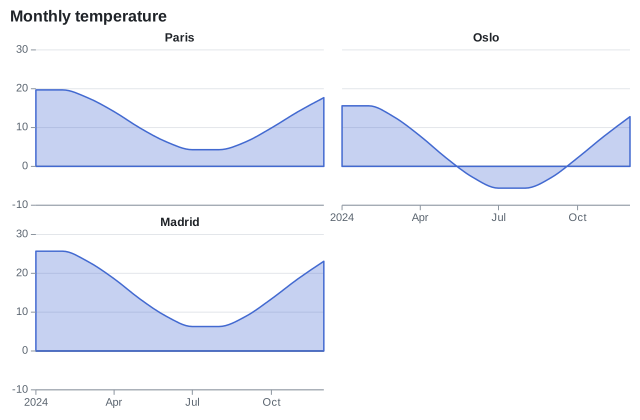
With Columns, the facets of x wrap onto rows, each chart with its header. The axis of x is drawn under the last chart of each column.
var plot = new Plot { Title = "Monthly temperature", Height = 420, Facets = { Columns = 2 } };
plot.Add(new RuleYMark(0));
plot.Add(new AreaMark<Reading>(SampleData.Readings, x: reading => reading.Date, y: reading => reading.Temperature)
{
    FacetX = reading => reading.City,
    FillOpacity = 0.3,
    StrokeColor = "#4269d0",
    Curve = Curve.MonotoneX,
});
Grid of facets
FacetX and FacetY together make a grid. XDomain and YDomain set the order of the facets.
var plot = new Plot { Title = "Efficiency by weight", Height = 420, Clip = true };
plot.Add(new DotMark<Car>(SampleData.Cars, x: car => car.Weight, y: car => car.Mpg)
{
    FacetX = car => car.Origin,
    FacetY = car => car.Horsepower >= 150 ? "Powerful" : "Economical",
    Fill = car => car.Origin,
    Radius = 5,
});
plot.Facets.YDomain = ["Economical", "Powerful"];
plot.XAxis.Label = "Weight (kg)";
plot.Legend.Visible = false;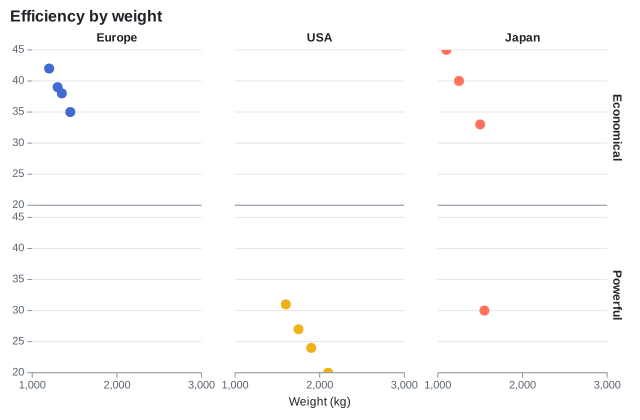
Faceted pies
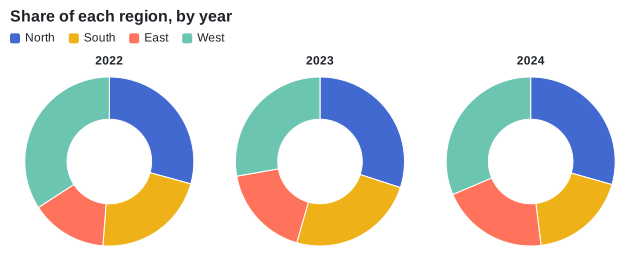
Facets work in polar coordinates too: each pie is a full circle of its own total.
var plot = new Plot
{
    Title = "Share of each region, by year",
    Height = 260,
    Coordinates = new PolarCoordinates { InnerRadius = 0.5 },
};
plot.Add(new ArcMark<Sale>(SampleData.Sales, value: sale => sale.Amount)
{
    FacetX = sale => sale.Year,
    Fill = sale => sale.Region,
});