 Meziantou.Framework
Maps
editChoropleth
A choropleth colors regions by a value. Read the regions with the Meziantou.Framework.Geo package, a dependency of the charts: GeoJson.Parse returns the features of a GeoJSON document, and the package reads other formats too, such as TopoJSON and Shapefile. Draw the features with a GeoMark<T>: its Fill channel is mapped by the color scale, as for any mark. The Properties of a feature hold the values of its GeoJSON properties: a JSON number is a double and a string is a string. The examples need using Meziantou.Framework.Geo;.
var path = Path.Combine(AppContext.BaseDirectory, "TestData", "countries-110m.geojson");
var countries = GeoJson.Parse(File.ReadAllText(path))
    .Where(country => country.Properties["continent"] is not "Antarctica")
    .ToList();

var plot = new Plot
{
    Title = "GDP per person",
    Subtitle = "Natural Earth, 2019 estimates",
    Height = 380,
    Coordinates = new GeoCoordinates { Projection = new EqualEarthProjection(), Outline = true },

    // The fill is the logarithm of the GDP per person: one step of the scale per factor of 10, labeled in
    // dollars rounded to the hundreds
    ColorScale = new SequentialColorScale
    {
        Minimum = 3,
        Maximum = 5,
        TickFormat = value => "$" + NumberFormats.Si(Math.Round(Math.Pow(10, value) / 100, MidpointRounding.AwayFromZero) * 100),
    },
};
plot.Add(new GeoMark<GeoFeature>(countries, country => country.Geometry)
{
    Fill = country => Math.Log10((double)country.Properties["gdp_md"]! * 1_000_000 / (double)country.Properties["pop_est"]!),
    Title = country => (string?)country.Properties["name"],
});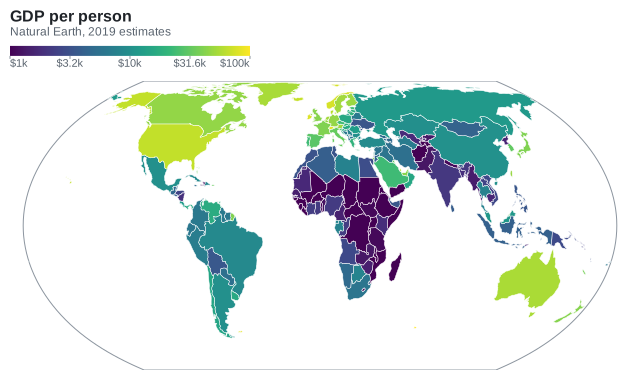
The countries of this example are those of Natural Earth (public domain), at the scale of 1:110m. A region whose fill value is missing is light gray, and so are the regions of a geo mark without a fill: a base map.
Points on a map
A plot with a geo mark uses GeoCoordinates: x is the longitude and y the latitude, in degrees. The other marks draw on the map with their usual channels: a DotMark<T> places its dots at their longitudes and latitudes, and a TextMark<T> labels them. The LabelPosition of a geometry is a position to label a region. The cities of this example are records like this:
public sealed record City(string Name, double Longitude, double Latitude, double Population);var path = Path.Combine(AppContext.BaseDirectory, "TestData", "countries-110m.geojson");
var countries = GeoJson.Parse(File.ReadAllText(path));
City[] cities =
[
new("London", -0.13, 51.51, 9.0), new("Paris", 2.35, 48.86, 11.1), new("Madrid", -3.70, 40.42, 6.7),
new("Berlin", 13.40, 52.52, 3.7), new("Rome", 12.50, 41.90, 4.3), new("Warsaw", 21.01, 52.23, 1.8),
new("Stockholm", 18.07, 59.33, 1.7), new("Athens", 23.73, 37.98, 3.2), new("Lisbon", -9.14, 38.72, 2.9),
new("Vienna", 16.37, 48.21, 2.0), new("Kyiv", 30.52, 50.45, 3.0), new("Bucharest", 26.10, 44.43, 1.8),
];
var plot = new Plot
{
Title = "Capitals of Europe",
Height = 440,
Clip = true,
Coordinates = new GeoCoordinates
{
Projection = new MercatorProjection(),
Extent = new GeoBounds(West: -12, South: 35, East: 34, North: 62),
GraticuleStep = 10,
},
};
plot.SizeLegend.Title = "Population (millions)";
plot.Add(new GeoMark<GeoFeature>(countries, country => country.Geometry));
// On a map, x is the longitude and y the latitude
plot.Add(new DotMark<City>(cities, x: city => city.Longitude, y: city => city.Latitude)
{
Size = city => city.Population,
FillColor = "#e5484d",
FillOpacity = 0.8,
});
plot.Add(new TextMark<City>(cities, text: city => city.Name, x: city => city.Longitude, y: city => city.Latitude) { OffsetY = -12 });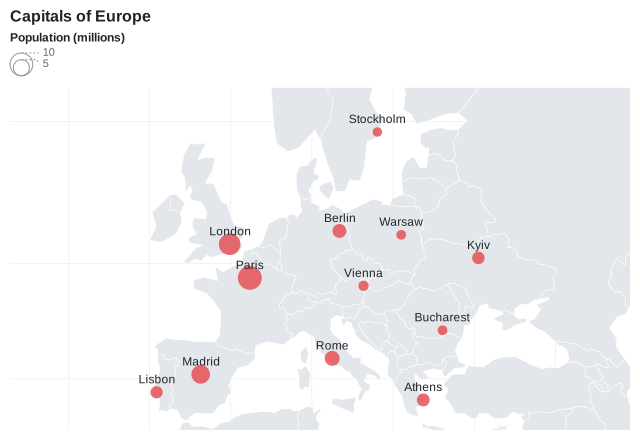
The map fits the shapes of the geo marks and the positions of the other marks. Set Extent to show a region instead, and Plot.Clip to hide what is outside of it. GraticuleStep draws the meridians and the parallels, and Outline the edge of the globe.
Map of a region
A map of a country or a continent shows its outline and what is inside: its subdivisions, lakes, rivers and cities. Take them from a map bundle of Meziantou.Framework.Geo.Maps: MapCatalog.GetMap returns the map of a region, and Load reads each of its layers. Draw a geo mark per layer, from the bottom to the top: the marks are drawn in the order they are added. The example needs using Meziantou.Framework.Geo.Maps;.
// The map bundle of Switzerland, in the maps folder next to the application
var map = MapCatalog.Default.GetMap("Switzerland");
var cantons = map.Load(MapLayer.StatesProvinces);
var lakes = map.Load(MapLayer.Lakes);
var rivers = map.Load(MapLayer.Rivers);
var borders = map.Load(MapLayer.Borders);

// The largest cities: the rank (0 to 14) orders the places, then their population
var cities = map.Load(MapLayer.Cities)
    .OrderByDescending(city => (int)city.Properties["rank"]!)
    .ThenByDescending(city => (long)city.Properties["population"]!)
    .Take(8)
    .Select(city => (Name: (string)city.Properties["name"]!, Position: ((GeoPoint)city.Geometry!).Position))
    .ToList();

var plot = new Plot
{
    Title = map.Name,
    Subtitle = "© OpenStreetMap contributors, Natural Earth",
    Height = 420,
    Clip = true,
    Coordinates = new GeoCoordinates { Projection = new MercatorProjection(), Extent = map.Bounds },
};

// The layers from the bottom: the cantons, the lakes and rivers, then the border of the country
plot.Add(new GeoMark<GeoFeature>(cantons, canton => canton.Geometry)
{
    FillColor = "#ebe6da",
    StrokeColor = "#ffffff",
    Title = canton => (string?)canton.Properties["name"],
});
plot.Add(new GeoMark<GeoFeature>(lakes, lake => lake.Geometry) { FillColor = "#a9cbe8", StrokeColor = ChartColor.Transparent });
plot.Add(new GeoMark<GeoFeature>(rivers, river => river.Geometry) { StrokeColor = "#6fa5d6" });
plot.Add(new GeoMark<GeoFeature>(borders, border => border.Geometry) { FillColor = ChartColor.Transparent, StrokeColor = "#6b6255", StrokeWidth = 1 });
plot.Add(new DotMark<(string Name, GeoPosition Position)>(cities, x: city => city.Position.Longitude, y: city => city.Position.Latitude) { FillColor = "#2b2b2b", Radius = 3 });
plot.Add(new TextMark<(string Name, GeoPosition Position)>(cities, text: city => city.Name, x: city => city.Position.Longitude, y: city => city.Position.Latitude) { OffsetY = -10 });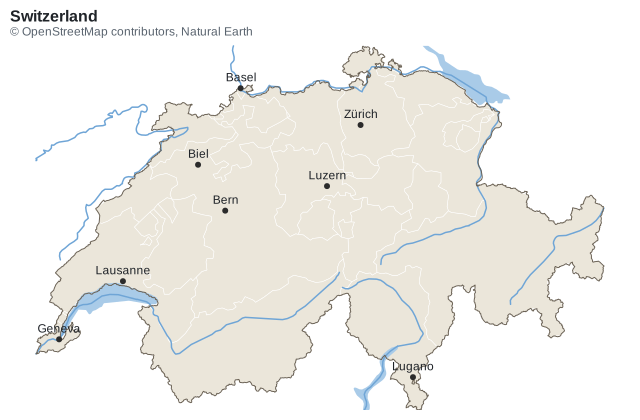
- Fit the map to the region: set Extent to Map.Bounds, the box of the region, and Plot.Clip to
true: the rivers and lakes that cross the border, and the neighbors of a continent, are cut at the edge of the map. - Choose the projection: Mercator keeps the shapes of a country. For a continent, an equal-area projection such as AlbersProjection, centered on the region, keeps the areas comparable. For Antarctica or the Arctic, use a map of a polar region.
- Style each layer: FillColor and StrokeColor set the colors of a geo mark;
ChartColor.Transparentdraws a border without fill, or a lake without outline. A Fill channel makes a choropleth of the subdivisions, as above. - Label the largest cities: the text marks do not move the labels that overlap. Keep a few cities, ordered by the
rankof the bundle (from 0 to 14, larger for larger places) and theirpopulation, or keep the capitals with thecapitalproperty. - Credit the data: the borders come from OpenStreetMap, whose license requires the attribution Map.Attribution gives.
Without a bundle, filter the features of any file to the region, and use the bounds of its outline as the extent: Extent = countries.Single(country => country.Properties["name"] is "Switzerland").Geometry!.GetBounds(). Clip cuts the other features to the region, so that the map does not draw the whole world outside of it. Render the map as an image with ToImage.
Map of a polar region
AzimuthalEquidistantProjection centers the map on a pole: Antarctica, which the other projections stretch along the bottom of the map, is drawn as it is on a globe. Set SouthPole for the South Pole, and an Extent from the pole to the latitude the map stops at:
var path = Path.Combine(AppContext.BaseDirectory, "TestData", "countries-110m.geojson");
var countries = GeoJson.Parse(File.ReadAllText(path));

var plot = new Plot
{
    Title = "Antarctica and the Southern Ocean",
    Width = 480,
    Height = 520,
    Clip = true,
    Coordinates = new GeoCoordinates
    {
        // Centered on the South Pole: the meridians are lines from the pole and the parallels circles around it
        Projection = new AzimuthalEquidistantProjection { SouthPole = true },
        Extent = new GeoBounds(West: -180, South: -90, East: 180, North: -40),
        GraticuleStep = 15,
    },
};
plot.Add(new GeoMark<GeoFeature>(countries, country => country.Geometry) { Fill = country => country.Properties["continent"] });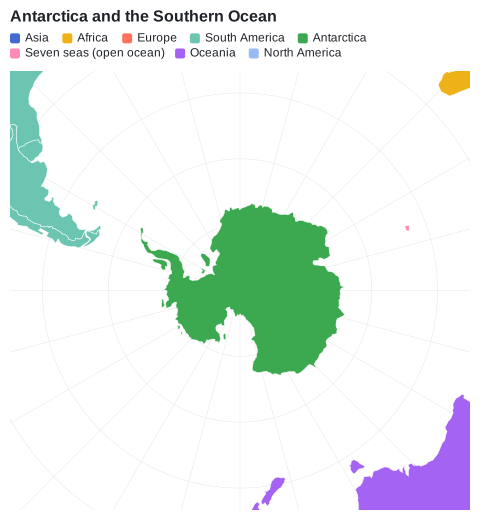
- The meridians are lines from the pole and the parallels are circles around it, so a box of longitudes and latitudes from the pole is a disc: the frame of the plot shows the parts of the neighbors in its corners, which Plot.Clip cuts at the edge of the frame.
- The data cuts the shapes that cross the antimeridian, such as Antarctica, along 180°. On the map of a pole, 180°W and 180°E are the same line: the mark fills the two sides as one shape, and does not outline the cut.
- The map of the Antarctica bundle of Meziantou.Framework.Geo.Maps has the land, coastline, seas and physical regions south of 60°S: use its Bounds as the extent.
Projections
Projection sets how the globe is flattened:
| Projection | Use it for |
|---|---|
| EquirectangularProjection | the default: the longitude is x and the latitude is y |
| MercatorProjection | the maps of web sites: it keeps the shapes, and enlarges the areas far from the equator |
| EqualEarthProjection | world choropleths: the areas are in proportion to the areas of the regions |
| AlbersProjection | the choropleths of a country or a continent: equal-area, centered on its CentralMeridian |
| AzimuthalEquidistantProjection | the maps of a polar region: centered on a pole, see map of a polar region |
The Albers projection measures the longitudes from its central meridian, and does not cut the shapes that cross the opposite meridian: give it the regions of the map, not the whole world. The projections are part of the Meziantou.Framework.Geo package: see projections to use them without a chart.