Meziantou.Framework
Flows
editSankey diagram
A SankeyMark<T> draws a row per link: the nodes are bars in columns, as tall as their values, and the links are bands as wide as their values. Alignment sets the column of each node. The links must not form a cycle.
public sealed record Flow(string Source, string Target, double Value);Flow[] flows =
[
new("Coal", "Electricity", 25), new("Gas", "Electricity", 30), new("Nuclear", "Electricity", 20), new("Solar", "Electricity", 10),
new("Gas", "Heating", 35), new("Oil", "Transport", 45),
new("Electricity", "Homes", 30), new("Electricity", "Industry", 25), new("Electricity", "Losses", 30),
new("Heating", "Homes", 25), new("Heating", "Losses", 10), new("Transport", "Losses", 30), new("Transport", "Mobility", 15),
];
var plot = new Plot { Title = "Energy flows", Height = 420 };
plot.Add(new SankeyMark<Flow>(flows, source: flow => flow.Source, target: flow => flow.Target, value: flow => flow.Value));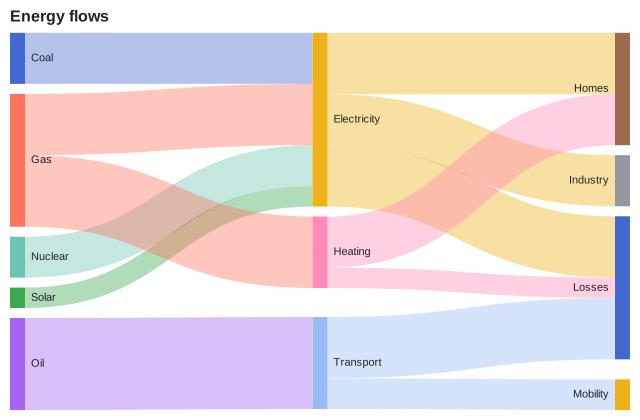
Chord diagram
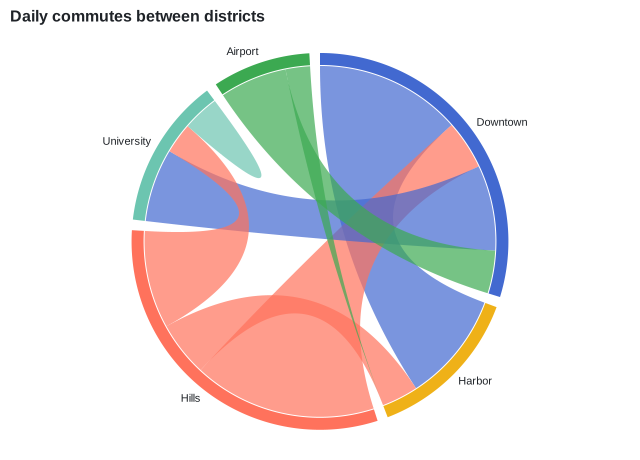
A ChordMark<T> draws a row per flow, like a Sankey diagram, but around a circle: each node is an arc as long as the total of the flows that leave it, and each pair of nodes is joined by a ribbon whose two ends are as wide as the flows in each direction. A ribbon takes the color of the node of its larger flow. Unlike a Sankey diagram, the flows may form cycles, and a node may flow to itself.
Flow[] commutes =
[
    new("Downtown", "Harbor", 120), new("Harbor", "Downtown", 90), new("Downtown", "Hills", 40), new("Hills", "Downtown", 150),
    new("Downtown", "University", 70), new("University", "Downtown", 60), new("Harbor", "Hills", 30), new("Hills", "Harbor", 45),
    new("University", "Hills", 25), new("Hills", "University", 80), new("Airport", "Downtown", 55), new("Downtown", "Airport", 35),
    new("Airport", "Harbor", 20), new("University", "University", 30),
];

var plot = new Plot { Title = "Daily commutes between districts", Height = 460 };
plot.Add(new ChordMark<Flow>(commutes, source: flow => flow.Source, target: flow => flow.Target, value: flow => flow.Value));