Meziantou.Framework
Cartesian charts
editBar chart
A BarMark<T> draws a bar per row, from zero to its value, in the band of its category.
Sale[] sales =
[
    new("North", 2024, 150),
    new("South", 2024, 95),
    new("East", 2024, 105),
    new("West", 2024, 160),
];

var plot = new Plot { Title = "Sales by region", Subtitle = "2024, in thousands of euros" };
plot.Add(new BarMark<Sale>(sales, x: sale => sale.Region, y: sale => sale.Amount));
var svg = plot.ToSvg();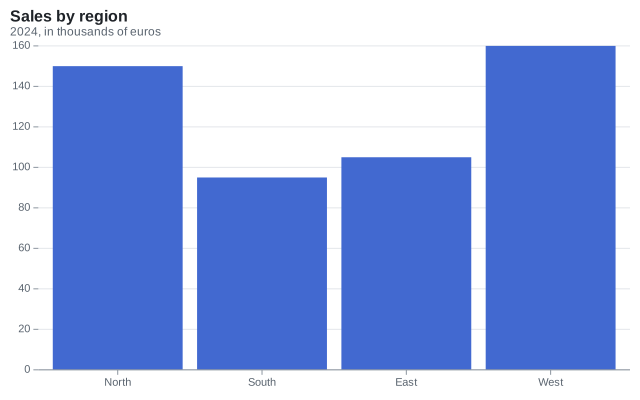
Grouped bar chart
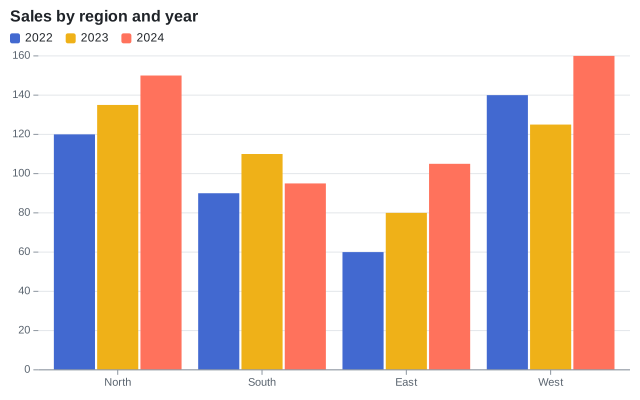
Group divides each band into side-by-side bars. A numeric channel that groups or stacks bars, such as a year, is used as a category.
var plot = new Plot { Title = "Sales by region and year" };
plot.Add(new BarMark<Sale>(SampleData.Sales, x: sale => sale.Region, y: sale => sale.Amount)
{
    Group = sale => sale.Year,
    Fill = sale => sale.Year,
});
Stacked bar chart
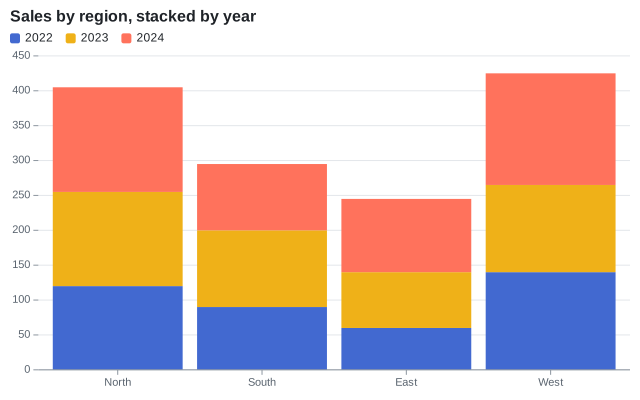
A StackTransform stacks the bars of a category. By default, positive values go up from zero and negative values go down.
var plot = new Plot { Title = "Sales by region, stacked by year" };
plot.Add(new BarMark<Sale>(SampleData.Sales, x: sale => sale.Region, y: sale => sale.Amount)
{
    Fill = sale => sale.Year,
    Transform = new StackTransform(),
});
100% stacked bar chart
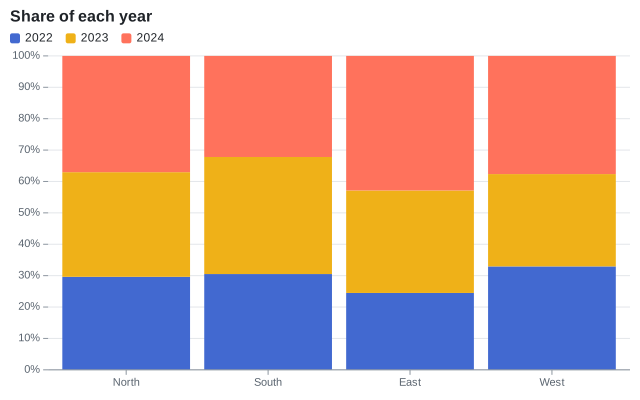
StackOffset.Expand normalizes each stack from 0 to 1.
var plot = new Plot
{
    Title = "Share of each year",
    YScale = new LinearScale { TickFormat = NumberFormats.Percent() },
};
plot.Add(new BarMark<Sale>(SampleData.Sales, x: sale => sale.Region, y: sale => sale.Amount)
{
    Fill = sale => sale.Year,
    Transform = new StackTransform { Offset = StackOffset.Expand },
});
Horizontal bar chart
Transposed coordinates draw the x scale vertically: the bars are horizontal. The categories read from the top down.
var plot = new Plot
{
    Title = "Sales by region",
    Coordinates = new CartesianCoordinates { Transposed = true },
    Height = 260,
};
plot.Add(new BarMark<Sale>(SampleData.Sales.Where(sale => sale.Year == 2024), x: sale => sale.Region, y: sale => sale.Amount)
{
    CornerRadius = 3,
});
plot.YAxis.Label = "Amount";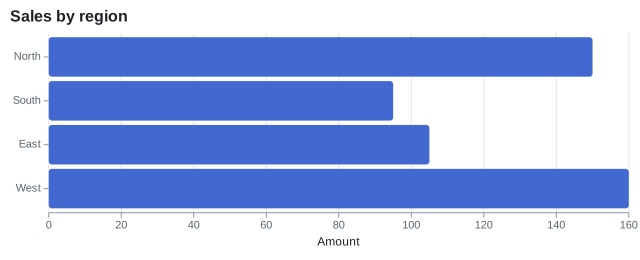
Line chart
A LineMark<T> joins the rows in their order. Times use a time scale, whose labels show the largest unit each tick does not fall on: the year, then the months.
var paris = SampleData.Readings.Where(reading => reading.City == "Paris");
var plot = new Plot { Title = "Monthly temperature in Paris" };
plot.Add(new LineMark<Reading>(paris, x: reading => reading.Date, y: reading => reading.Temperature) { MarkerRadius = 3 });
plot.YAxis.Label = "°C";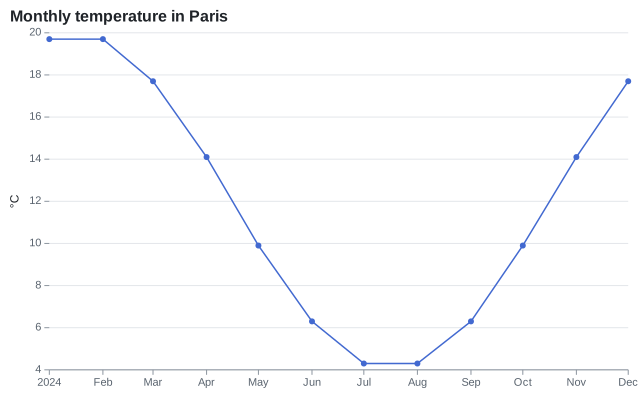
Multi-series line chart
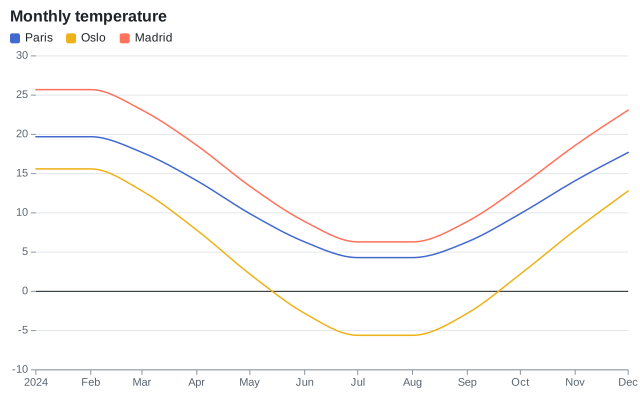
The Stroke channel draws a line per value, in its color. Curve.MonotoneX smooths the lines without overshooting the data.
var plot = new Plot { Title = "Monthly temperature" };
plot.Add(new RuleYMark(0));
plot.Add(new LineMark<Reading>(SampleData.Readings, x: reading => reading.Date, y: reading => reading.Temperature)
{
    Stroke = reading => reading.City,
    Curve = Curve.MonotoneX,
});
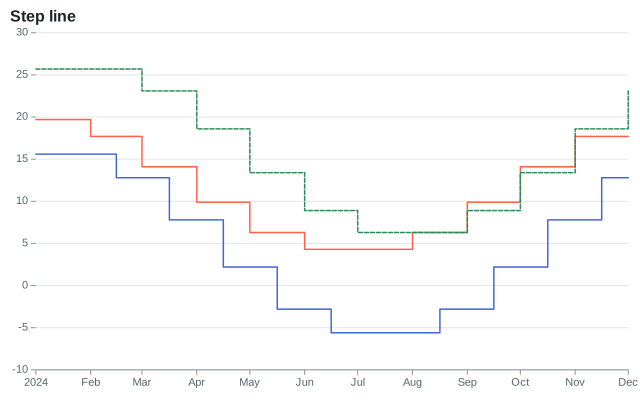
Step line
Curve.Step, Curve.StepBefore and Curve.StepAfter join the points with horizontal steps.
Area chart
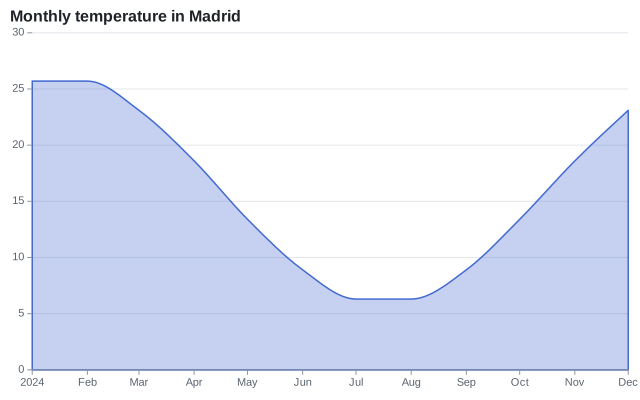
An AreaMark<T> fills the area between a line and zero, or another baseline (Y1).
var oslo = SampleData.Readings.Where(reading => reading.City == "Madrid");
var plot = new Plot { Title = "Monthly temperature in Madrid" };
plot.Add(new AreaMark<Reading>(oslo, x: reading => reading.Date, y: reading => reading.Temperature)
{
    FillOpacity = 0.3,
    StrokeColor = "#4269d0",
    Curve = Curve.MonotoneX,
});
Stacked area chart
A stack transform stacks the areas of the series.
var plot = new Plot { Title = "Sales by year, stacked by region" };
plot.Add(new AreaMark<Sale>(SampleData.Sales, x: sale => sale.Year, y: sale => sale.Amount)
{
    Fill = sale => sale.Region,
    Transform = new StackTransform(),
});
plot.XScale = new LinearScale { Ticks = [2022, 2023, 2024], TickFormat = year => year.ToString("0", CultureInfo.InvariantCulture) };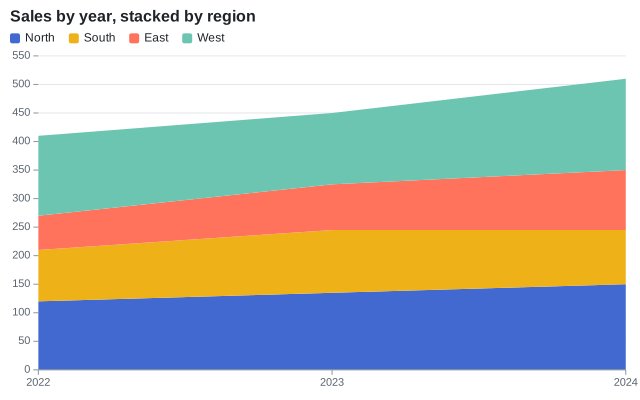
Streamgraph
StackOffset.Silhouette centers the stacks on zero, and StackOrder.InsideOut puts the series that peak first in the middle.
var plot = new Plot { Title = "Streamgraph" };
plot.Add(new AreaMark<Reading>(SampleData.Readings, x: reading => reading.Date, y: reading => reading.Temperature + 15)
{
    Fill = reading => reading.City,
    Curve = Curve.MonotoneX,
    Transform = new StackTransform { Offset = StackOffset.Silhouette, Order = StackOrder.InsideOut },
});
plot.YAxis.Visible = false;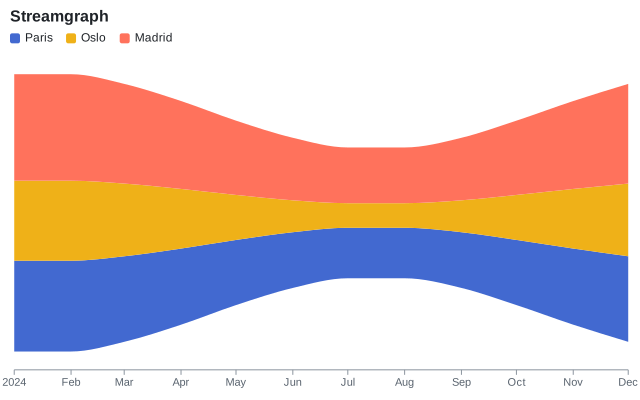
Scatter plot
A DotMark<T> draws a dot per row. The fill channel colors the dots and adds a legend; the title channel adds a tooltip.
var plot = new Plot { Title = "Fuel efficiency by weight" };
plot.Add(new DotMark<Car>(SampleData.Cars, x: car => car.Weight, y: car => car.Mpg)
{
    Fill = car => car.Origin,
    Title = car => car.Name,
});
plot.XAxis.Label = "Weight (kg)";
plot.YAxis.Label = "Miles per gallon";
plot.XAxis.Grid = true;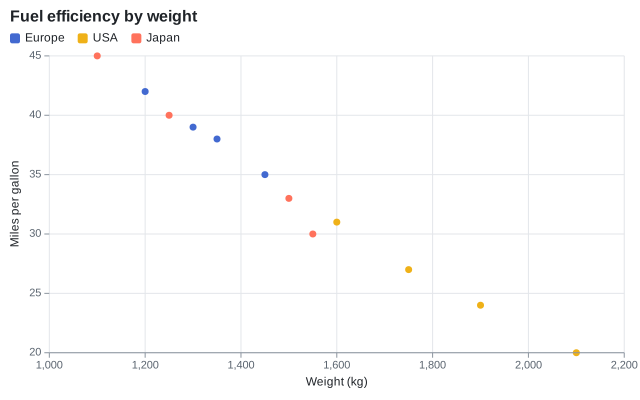
Bubble chart
The Size channel goes through the size scale: the area of a dot is proportional to its value. A legend of nested circles explains the sizes, next to the legend of the colors.
var plot = new Plot { Title = "Power, weight and efficiency" };
plot.Add(new DotMark<Car>(SampleData.Cars, x: car => car.Weight, y: car => car.Mpg)
{
    Size = car => car.Horsepower,
    Fill = car => car.Origin,
    FillOpacity = 0.7,
    StrokeColor = ChartColor.White,
});
plot.SizeScale = new SizeScale { MaxRadius = 20 };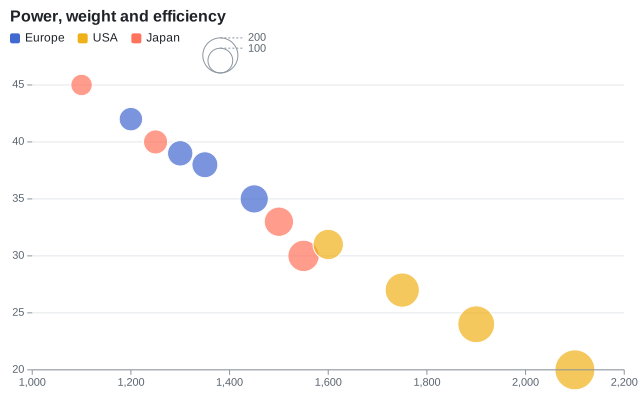
Size legend
Plot.SizeLegend sets the title of the legend of the sizes, its values (up to three round values of the domain by default) and its visibility. It follows the Position of the legend of the colors: on the right, the two legends are stacked; above or under the chart, they are side by side.
var plot = new Plot { Title = "Power, weight and efficiency" };
plot.Add(new DotMark<Car>(SampleData.Cars, x: car => car.Weight, y: car => car.Mpg)
{
    Size = car => car.Horsepower,
    Fill = car => car.Origin,
    FillOpacity = 0.7,
    StrokeColor = ChartColor.White,
});
plot.SizeScale = new SizeScale { MaxRadius = 20 };
plot.Legend.Position = LegendPosition.Right;
plot.Legend.Title = "Origin";
plot.SizeLegend.Title = "Horsepower";
plot.SizeLegend.Values = [100, 150, 250];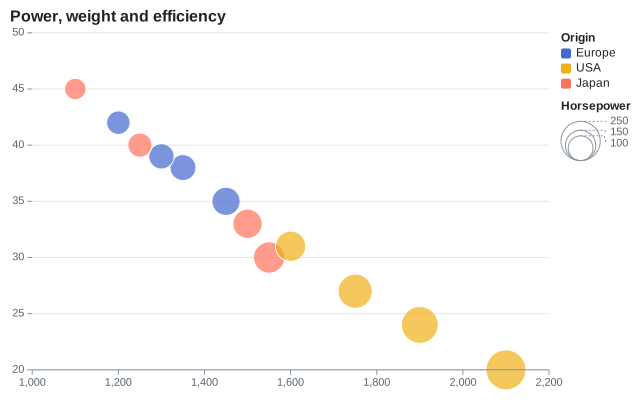
Annotations
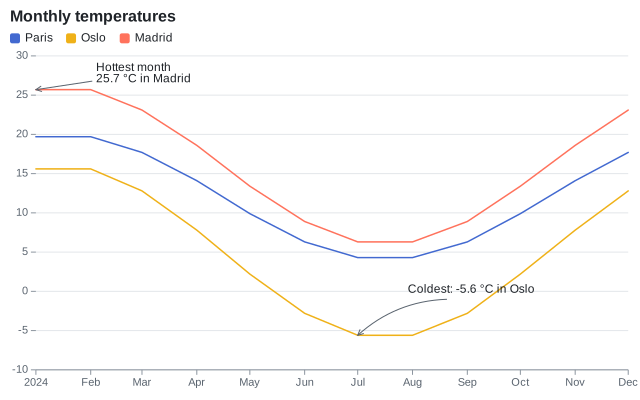
An AnnotationMark<T> draws a text at an offset of DX and DY pixels from a point, and an arrow from the text to the point. The text is anchored on the side of the offset, a line break starts a new line, and Bend curves the arrow.
var plot = new Plot { Title = "Monthly temperatures" };
plot.Add(new LineMark<Reading>(SampleData.Readings, x: reading => reading.Date, y: reading => reading.Temperature) { Stroke = reading => reading.City });
plot.Add(new AnnotationMark<Reading>(
    SampleData.Readings.Where(reading => reading.City == "Madrid").MaxBy(reading => reading.Temperature) is { } hottest ? [hottest] : [],
    x: reading => reading.Date,
    y: reading => reading.Temperature,
    text: reading => "Hottest month\n" + NumberFormats.Default(reading.Temperature) + " °C in Madrid")
{
    DX = 60,
    DY = -5,
});
plot.Add(new AnnotationMark<Reading>(
    SampleData.Readings.Where(reading => reading.City == "Oslo").MinBy(reading => reading.Temperature) is { } coldest ? [coldest] : [],
    x: reading => reading.Date,
    y: reading => reading.Temperature,
    text: reading => "Coldest: " + NumberFormats.Default(reading.Temperature) + " °C in Oslo")
{
    DX = 50,
    DY = -40,
    Bend = -40,
});
Secondary axis
Marks that set UseSecondaryYScale use the secondary y scale (Plot.SecondaryYScale), whose axis is on the right: two measures of different units in one chart.
Share[] revenue = [new("Q1", 120), new("Q2", 150), new("Q3", 140), new("Q4", 190)];
Share[] growth = [new("Q1", 0.04), new("Q2", 0.25), new("Q3", -0.07), new("Q4", 0.36)];

var plot = new Plot
{
    Title = "Revenue and growth",
    SecondaryYScale = new LinearScale { TickFormat = NumberFormats.Percent() },
};
plot.Add(new BarMark<Share>(revenue, x: quarter => quarter.Name, y: quarter => quarter.Value) { Fill = _ => "Revenue" });
plot.Add(new LineMark<Share>(growth, x: quarter => quarter.Name, y: quarter => quarter.Value)
{
    UseSecondaryYScale = true,
    Stroke = _ => "Growth",
    StrokeWidth = 2.5,
    MarkerRadius = 4,
});
plot.YAxis.Label = "Revenue (k€)";
plot.SecondaryYAxis.Label = "Growth";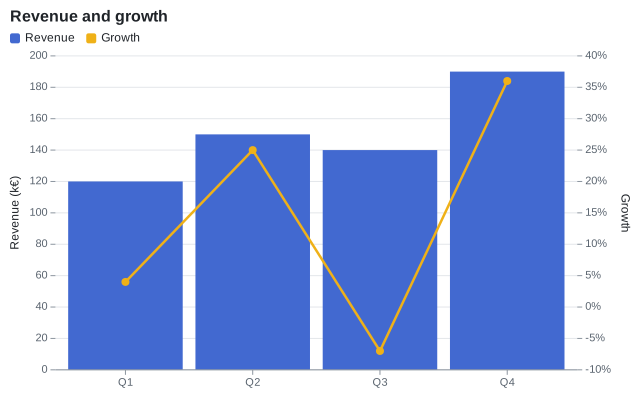
Reference lines
RuleYMark draws horizontal lines and RuleXMark<T> vertical lines, across the plot area.
var paris = SampleData.Readings.Where(reading => reading.City == "Paris");
var plot = new Plot { Title = "Months above 15 °C" };
plot.Add(new LineMark<Reading>(paris, x: reading => reading.Date, y: reading => reading.Temperature));
plot.Add(new RuleYMark(15) { StrokeColor = "#e5484d", StrokeDashArray = [4, 4] });
plot.Add(new RuleXMark<DateOnly>([new DateOnly(2024, 7, 1)], x: date => date) { StrokeColor = "#8c959f" });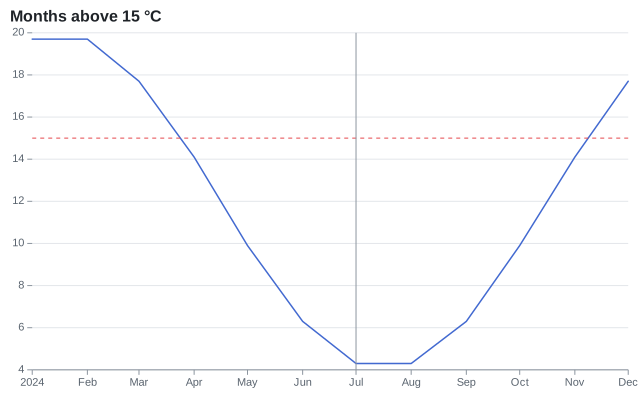
Lollipop chart
A rule from zero to the value, then a dot at the value.
var sales = SampleData.Sales.Where(sale => sale.Year == 2024).ToArray();
var plot = new Plot { Title = "Lollipop" };
plot.Add(new RuleXMark<Sale>(sales, x: sale => sale.Region) { Y1 = _ => 0, Y2 = sale => sale.Amount, StrokeColor = "#8c959f" });
plot.Add(new DotMark<Sale>(sales, x: sale => sale.Region, y: sale => sale.Amount) { Radius = 6 });
plot.YScale = new LinearScale { Zero = true };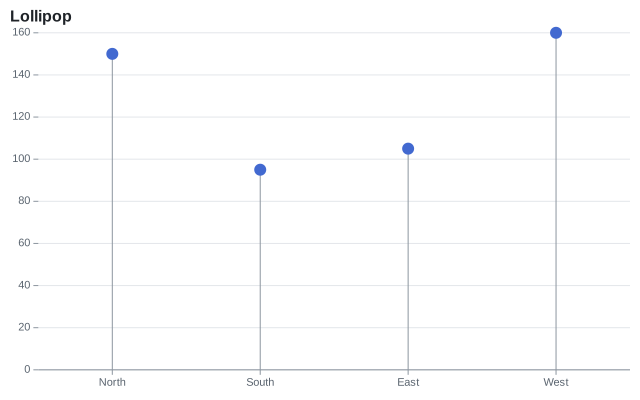
Dumbbell chart
A rule between two values and a dot at each end, in transposed coordinates.
var start = SampleData.Sales.Where(sale => sale.Year == 2022).ToDictionary(sale => sale.Region, sale => sale.Amount);
var end = SampleData.Sales.Where(sale => sale.Year == 2024).ToArray();
var plot = new Plot { Title = "From 2022 to 2024", Coordinates = new CartesianCoordinates { Transposed = true }, Height = 240 };
plot.Add(new RuleXMark<Sale>(end, x: sale => sale.Region) { Y1 = sale => start[sale.Region], Y2 = sale => sale.Amount, StrokeColor = "#8c959f", StrokeWidth = 2 });
plot.Add(new DotMark<Sale>(end, x: sale => sale.Region, y: sale => start[sale.Region]) { FillColor = "#9498a0", Radius = 5 });
plot.Add(new DotMark<Sale>(end, x: sale => sale.Region, y: sale => sale.Amount) { Radius = 5 });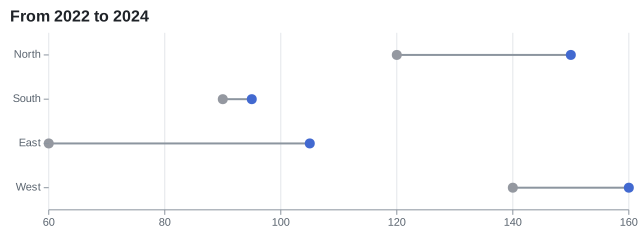
Combo chart
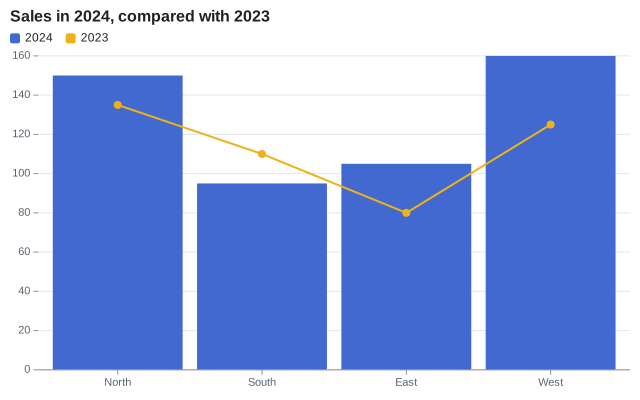
Marks of different kinds share the scales of the plot: a line over bars puts its points in the middle of the bands. A constant category in a color channel names each layer in the legend.
var plot = new Plot { Title = "Sales in 2024, compared with 2023" };
plot.Add(new BarMark<Sale>(SampleData.Sales.Where(sale => sale.Year == 2024), x: sale => sale.Region, y: sale => sale.Amount)
{
    Fill = _ => "2024",
});
plot.Add(new LineMark<Sale>(SampleData.Sales.Where(sale => sale.Year == 2023), x: sale => sale.Region, y: sale => sale.Amount)
{
    Stroke = _ => "2023",
    MarkerRadius = 4,
    StrokeWidth = 2,
});
Population pyramid
Transposed bars with negative values for one side. The tick format shows the absolute values.
public sealed record AgeGroup(string Age, string Sex, double Population);string[] ages = ["80+", "60-79", "40-59", "20-39", "0-19"];
double[] men = [1.6, 7.1, 8.4, 7.9, 8.0];
double[] women = [2.7, 7.9, 8.6, 7.9, 7.6];
var groups = ages.SelectMany((age, i) => new[] { new AgeGroup(age, "Men", men[i]), new AgeGroup(age, "Women", women[i]) });
var plot = new Plot
{
Title = "Population by age, in millions",
Height = 280,
Coordinates = new CartesianCoordinates { Transposed = true },
YScale = new LinearScale { TickFormat = value => Math.Abs(value).ToString(CultureInfo.InvariantCulture) },
};
// The bars of the men go to the left: their values are negative
plot.Add(new BarMark<AgeGroup>(groups, x: group => group.Age, y: group => group.Sex == "Men" ? -group.Population : group.Population)
{
Fill = group => group.Sex,
});
plot.Add(new RuleYMark(0));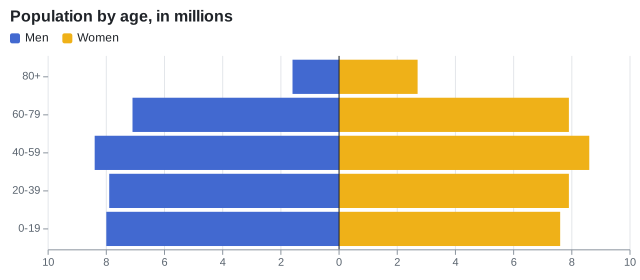
Slope chart
Lines over two categories of a point scale, labeled at their end with a TextMark<T>.
var sales = SampleData.Sales.Where(sale => sale.Year is 2022 or 2024).ToArray();
var plot = new Plot { Title = "From 2022 to 2024", Width = 360, Height = 380, XScale = new PointScale { Padding = 0.3 } };
plot.Add(new LineMark<Sale>(sales, x: sale => sale.Year.ToString(CultureInfo.InvariantCulture), y: sale => sale.Amount)
{
    Stroke = sale => sale.Region,
    MarkerRadius = 4,
});
plot.Add(new TextMark<Sale>(sales.Where(sale => sale.Year == 2024), text: sale => sale.Region, x: sale => "2024", y: sale => sale.Amount)
{
    Anchor = SceneTextAnchor.Start,
    OffsetX = 8,
    Fill = sale => sale.Region,
});
plot.Legend.Visible = false;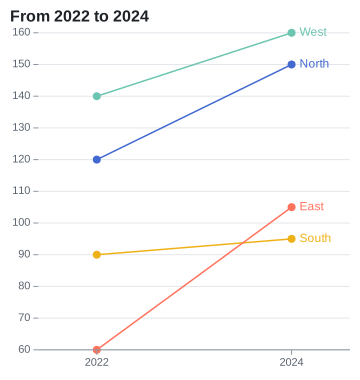
Error bars
A rule from Y1 to Y2 at each category, and a dot at the mean.
public sealed record GroupSummary(string Group, double Mean, double Deviation);var summaries = SampleData.Measurements
.GroupBy(measurement => measurement.Group)
.Select(group =>
{
var mean = group.Average(measurement => measurement.Value);
var deviation = Math.Sqrt(group.Average(measurement => Math.Pow(measurement.Value - mean, 2)));
return new GroupSummary(group.Key, mean, deviation);
})
.ToArray();
var plot = new Plot { Title = "Mean and standard deviation", Height = 300 };
plot.Add(new RuleXMark<GroupSummary>(summaries, x: summary => summary.Group)
{
Y1 = summary => summary.Mean - summary.Deviation,
Y2 = summary => summary.Mean + summary.Deviation,
StrokeWidth = 2,
});
plot.Add(new DotMark<GroupSummary>(summaries, x: summary => summary.Group, y: summary => summary.Mean) { Radius = 5 });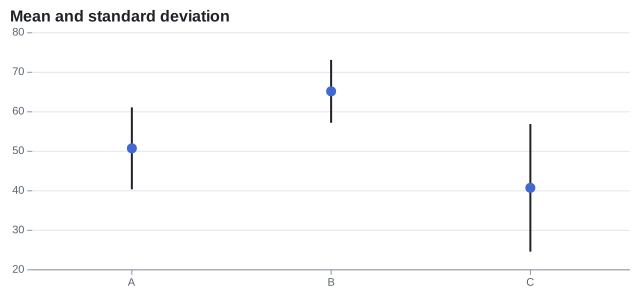
Gantt chart
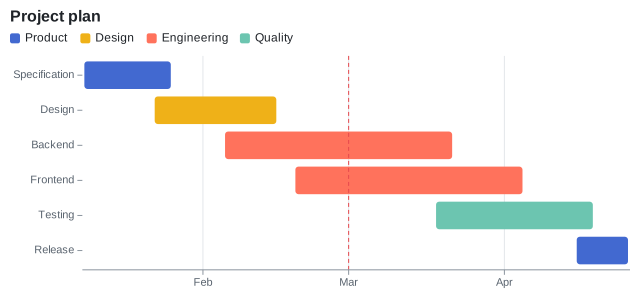
A RectMark<T> from the start to the end of each task (X1 and X2, on a time scale), in the band of its name (Y).
public sealed record GanttTask(string Name, string Team, DateOnly Start, DateOnly End);GanttTask[] tasks =
[
new("Specification", "Product", new(2024, 1, 8), new(2024, 1, 26)),
new("Design", "Design", new(2024, 1, 22), new(2024, 2, 16)),
new("Backend", "Engineering", new(2024, 2, 5), new(2024, 3, 22)),
new("Frontend", "Engineering", new(2024, 2, 19), new(2024, 4, 5)),
new("Testing", "Quality", new(2024, 3, 18), new(2024, 4, 19)),
new("Release", "Product", new(2024, 4, 15), new(2024, 4, 26)),
];
var plot = new Plot { Title = "Project plan", Height = 300 };
plot.Add(new RectMark<GanttTask>(tasks)
{
X1 = task => task.Start,
X2 = task => task.End,
Y = task => task.Name,
Fill = task => task.Team,
Inset = 4,
CornerRadius = 3,
Title = task => $"{task.Name}: {task.Start:MMM d} - {task.End:MMM d}",
});
plot.Add(new RuleXMark<DateOnly>([new DateOnly(2024, 3, 1)], x: today => today) { StrokeColor = "#e5484d", StrokeDashArray = [4, 3] });
plot.XAxis.Grid = true;